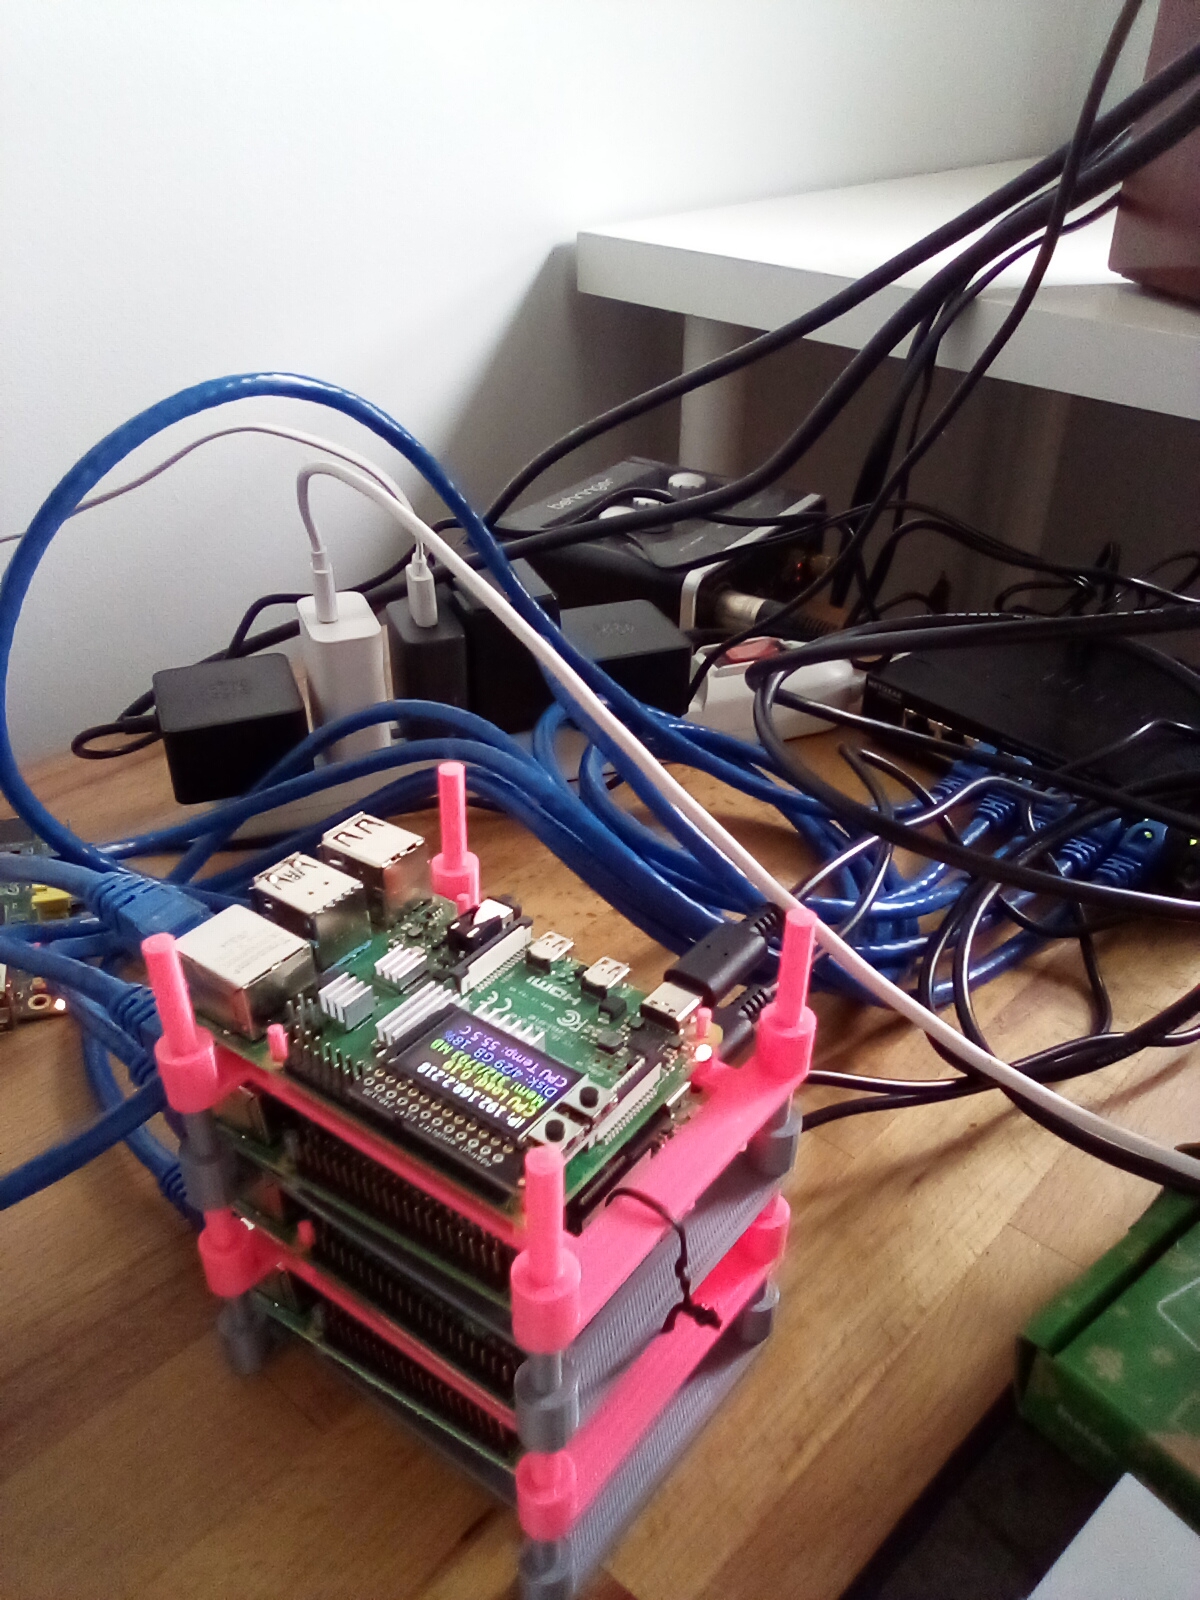
So, I’ve set up a cluster of 4 Raspberry Pis to learn and experiment with distributed systems.

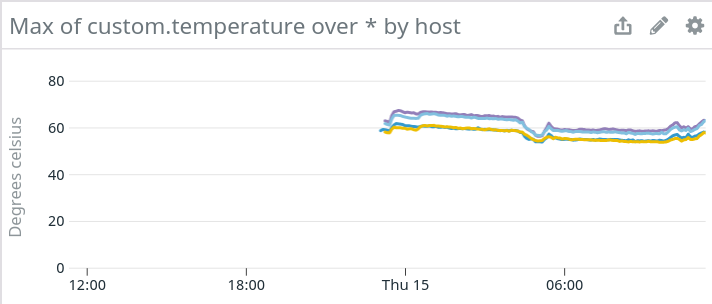
I also wanted to track various metrics while running the cluster, so I set up Datadog APMs on all of them and since the pis usually run hot, I wanted to track their temperatures for warning signs. Here is how you can send your temperature info to Datadog.
Create 2 files, a temp.yaml and a temp.py (the names should match).
1 | # /etc/datadog-agent/conf.d/temp.yaml |
1 | # /etc/datadog-agent/checks.d/temp.py |
The meat of this code is the following, where we send a guage metric named
custom.temperature and send it the temperature by reading
/sys/class/thermal/thermal_zone0/temp (this is how you can read the
temperature for a pi with ubuntu installed, you may have to tweak this bit for
other distros)
1
2
3
4
5
6self.gauge(
"custom.temperature",
(int(Path("/sys/class/thermal/thermal_zone0/temp").read_text().strip()) / 1000),
tags=[],
)
That’s it, you can tack other metrics in their too if you’d like to. You’ll also need to restart your datadog agent for it to start sending these metrics.
You can read more about custom metrics in Datadog here
