When you open Google Chrome’s Network tab, you don’t see the traffic for websockets. I spent quite some time trying to see the messages between my browser and the phoenix server. I was expecting to see a lot of rows in the network tab one for every message.
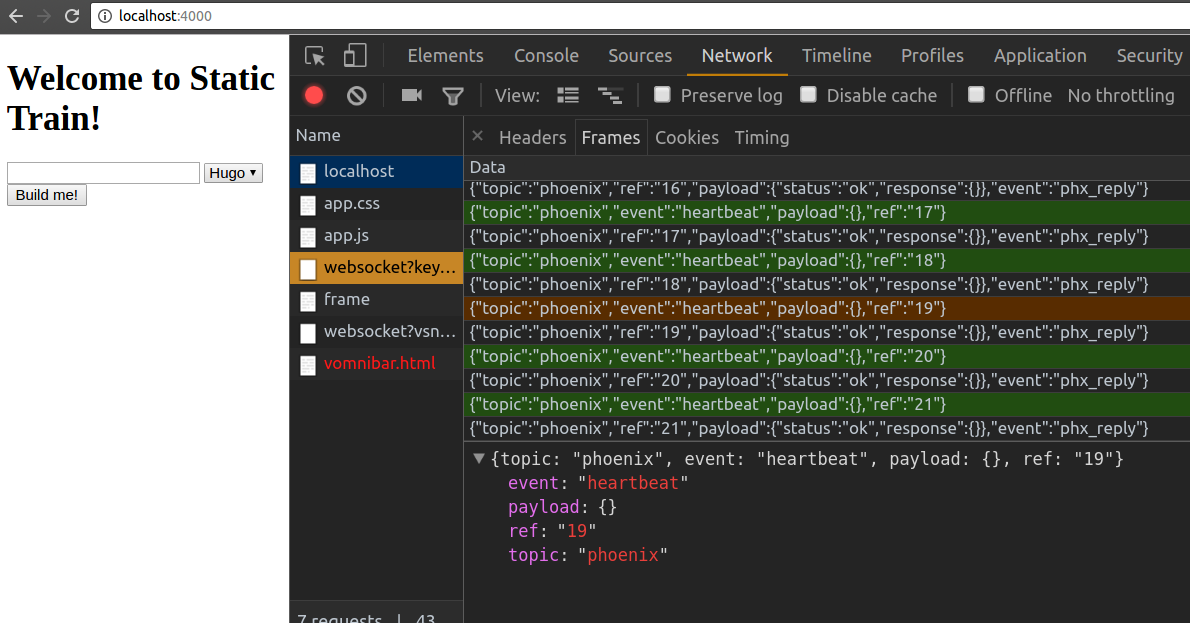
However, since websockets don’t follow a request-response pattern. They are shown in a different tab. To see the messages sent on the websocket. Click on your Network tab and then click on the websocket request. This should show you a pane with a Frames tab. This Frames tab should show you all the messages that are being sent back and forth on the websocket.
Here is a screenshot:

I am currently working on LiveForm which makes
setting up contact forms on your website a breeze.